Real-time-Transit-Data-Pipeline-MBTA-ETL-CDC
Real-time Transit Data Pipeline: ETL from MBTA to MySQL and CDC with MongoDB
This project presents a comprehensive and integrated real-world data engineering pipeline that leverages real-time transit data from the Massachusetts Bay Transportation Authority (MBTA).
The pipeline demonstrates the use of Extract, Transform, Load (ETL) and Change Data Capture (CDC) processes to ensure real-time data ingestion and storage, as well as data synchronization across storage systems for efficient data replication and consistency. Utilizing a variety of data engineering tools and technologies, including Docker, Apache Airflow, MySQL, MongoDB, and Python MySQL Replication, the pipeline supports real-time data availability, event-driven architectures, and disaster recovery. This makes it an exemplary model for handling dynamic data in a production-like environment.
In addition to real-time data handling, the pipeline also facilitates historical data analysis and visualization. This enables time-series analysis and trend detection to provide insights into transit patterns, informing decision-making and optimizing transit operations.
Table of Contents
Overview
The pipeline is designed to:
- Real-time Data Ingestion:
- Create a MySQL database within a Docker container to store real-time data fetched from the MBTA API.
- Periodically call the MBTA API every 10 seconds, parse the JSON response, and store the data in the MySQL database for further analysis.
- Run the server for 24 hours to continuously collect and store data.
- Change Data Capture (CDC):
- Monitor and propagate changes from the MySQL database to a MongoDB database.
- Capture MySQL binary logs to track and replicate data changes efficiently.
- Data analysis and visualization:
- Perform in-depth data analysis and visualization on data stored in the MySQL database using Jupyter Notebook.
- Calculate the average time for a bus to complete Route 1 and estimate bus speed using the Haversine formula.
- Visualize the analysis results to understand traffic patterns and peak times in Boston.
Benefits
- Real-Time Data Synchronization: Ensuring MongoDB is always in sync with MySQL by capturing and storing data changes in near real-time.
- Data Consistency and Integrity Monitoring: Monitoring data consistency and integrity between MySQL and MongoDB using CDC logs.
- Event-Driven Architectures: Triggering actions based on changes captured by CDC, enhancing system responsiveness and automation.
- Disaster Recovery and Backup: Utilizing MySQL binary logs captured by CDC for robust disaster recovery.
- Historical Analysis and Visualization: Deriving insights and visualizations from the MBTA data stored in MySQL.
Architecture
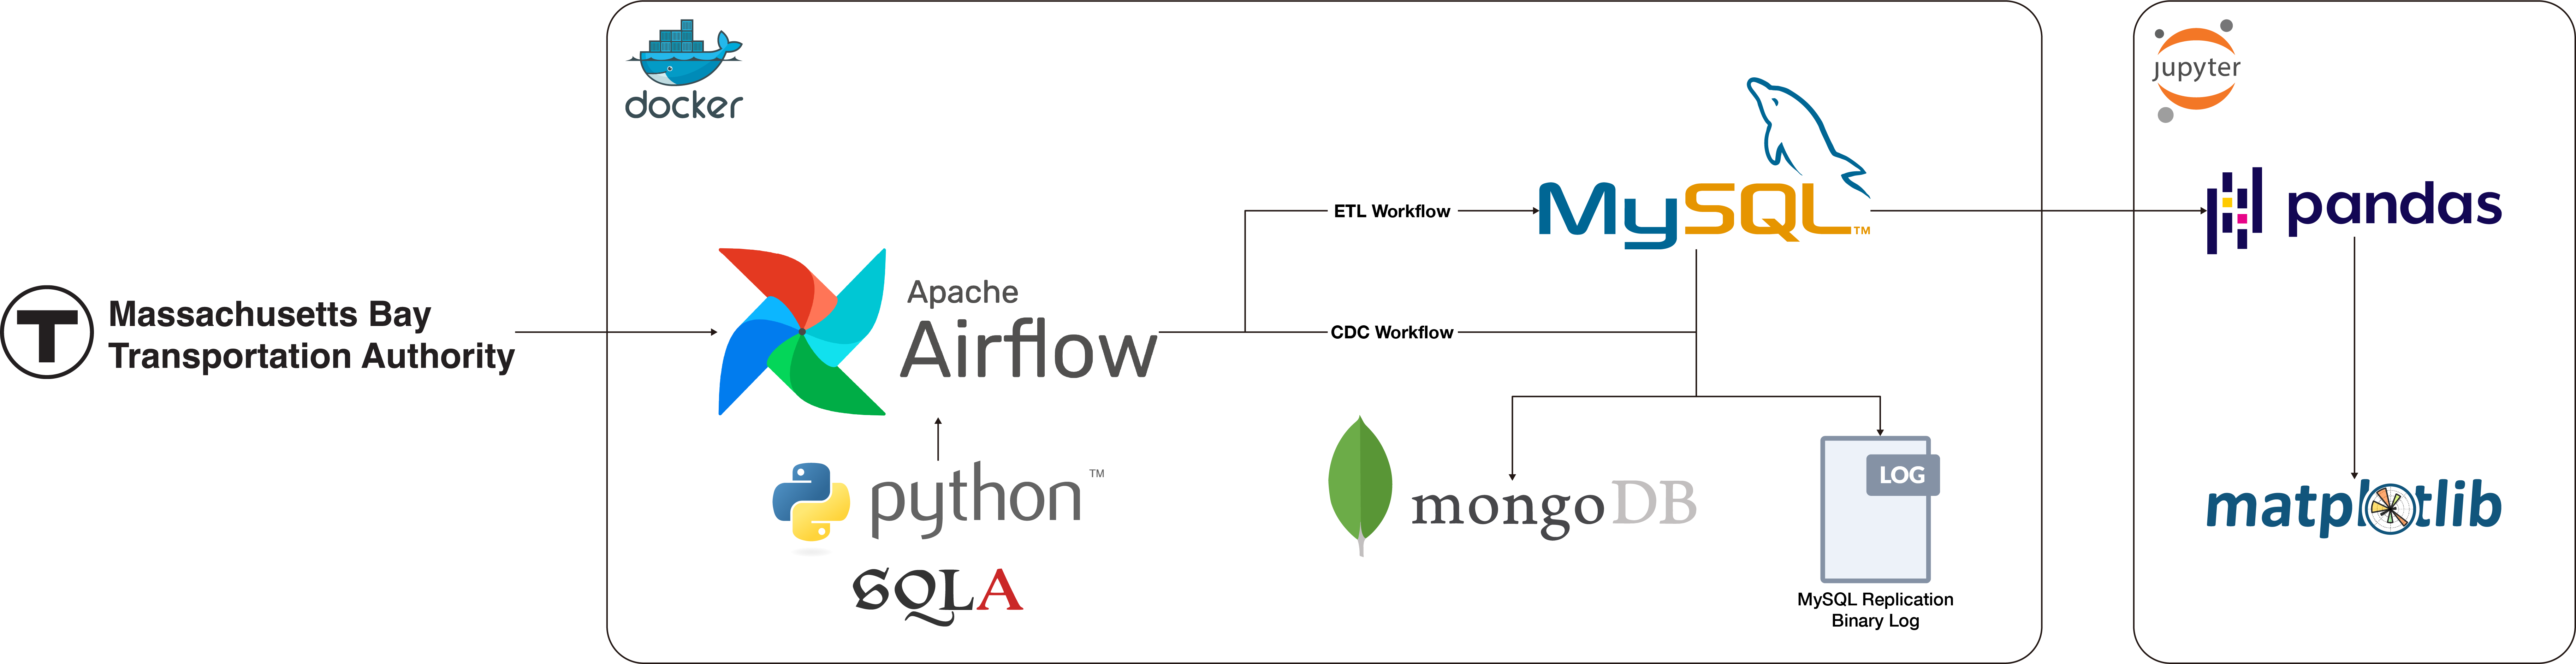
- MBTA API: Source of real-time transit data.
- Docker: Containerization of services.
- Apache Airflow: ETL and CDC workflows orchestration.
- MySQL: Stores real-time data fetched from MBTA API.
- MongoDB: Receives data changes from MySQL via CDC.
- Python MySQL Replication: Supports the MySQL binary log CDC process.
- SQLAlchemy: Facilitates database connections and interactions.
- Pandas and Matplotlib: Data analysis and visualization performed in Jupyter Notebook.
Prerequisites
- Docker installation.
- Python 3.9 or higher.
System Setup
- Clone the repository.
- Navigate to the root directory where the Dockerfile is located.
- Start Docker container for Apache Airflow.
docker-compose up - Launch the Airflow web UI.
open http://localhost:8080 - Set up Docker network, build customized container image for MySQL, and start Docker containers for both MySQL and MongoDB.
python3 containers.py -network python3 containers.py -image python3 containers.py -create - Deploy the Airflow DAG and start the pipeline.
airflow dags trigger mbta_etl_cdc_pipelineor manually trigger the DAG from the Airflow web UI.